By: Dan Grant
Statistics have come to dominate our beloved sports these days. Over the past several months, Dan Grant has been working on an ongoing series designed to explain some of the more advanced statistics involved in professional sports to you, the faithful Same Page reader. Some you may be quite familiar with, some you may dismiss, others you may be confused about; that’s where we come in. Check out previous columns in the series, about hockey, baseball and football. And Fear Not the Abbrv!
The NBA Finals started with a sweaty bang last night, as the San Antonio Spurs and Miami Heat battle once again for basketball supremacy. The twist this time around? The air conditioning in San Antonio’s AT & T Center malfunctioned, leaving temperatures, according to the immortal Doris Burke, in the high 80’s for most of the game (that’s around 30 degrees Celsius) and soaring into the 90’s in the fourth quarter.
LeBron James had to leave this game mid-way through the fourth quarter with severe muscle cramps in his legs, the only recurring injury that has plagued him in his career. The extreme heat can only have affected him negatively- cramps, of course, are exacerbated by dehydration. When he left, Miami was up 2, with just under 8 minutes remaining in the game. They wound up losing by 15, 110-95, illustrating just how important it is to have the best player in the world on your team – you know, as long as he can walk.

That Is Not The Chicken Dance
The point is, statistics aren’t everything. Crazy, I know! Someone looking at a box score in thirty years won’t know about the severe temperature in the game. They’ll wonder why LeBron played so few minutes in the fourth quarter, they’ll look at the Spurs improbable 31-9 run to end the game and might assume San Antonio simply played better. And they did. But playing the Heat without LeBron is like seeing the Jackson 5 without Michael. Don’t worry Chris Bosh, you aren’t Tito. Mario Chalmers definitely is.
That being said, teams of this calibre are the reason advanced statistics are so valuable. They’re the benchmark. The little things they do well are what separate them from the rest of the league. They’re what everyone else is striving to be. You’ll hear generalities thrown around during broadcasts, such as, “these are the best two shooting teams in the league.” And they are. But why is that? Where does that analysis come from? Are they talking about field goal percentage? Or is it something deeper?
The NBA, as much as any sport outside baseball, has embraced the statistical revolution. There have been “secret” stats that front offices have used for years that aren’t widely available to the public, but that weigh hugely into front office decisions and into game planning. During the NBA Finals, game planning becomes the be all and end all. The funny thing is, the NBA, more than any other sport, is one where statistics are both incredibly important, but only a piece of the puzzle. Team chemistry is essential, more than in any other sport. Team culture can make or break a champion. Body language is often telling. Intelligence is an undervalued tool that has vaulted the careers of guys like the Heat’s Shane Battier and the Spurs’ Manu Ginobili beyond that of a simple sixth man.
However, once all those things have been factored in – chemistry, culture, attitude and intelligence – and you have the team you want in regards to those areas, advanced statistics can push things to the next level.
I’m going to use the Heat and Spurs (and some other pertinent examples!), to demonstrate just how valuable these statistics can be.
SHOOTING
When it comes down to it, it’s all about putting the ball in the basket. There are many shooting statistics that have been developed to try and quantify the different types of shots an NBA player is most successful with.
The Houston Rockets, for example, embrace the idea that they should either be shooting lay-ups/dunks or three point shots and nothing in between. Just look at the shot chart (compiled by Grantland’s statistical guru, Kirk Goldsberry) of their best player, First Team All-NBA guard James Harden.
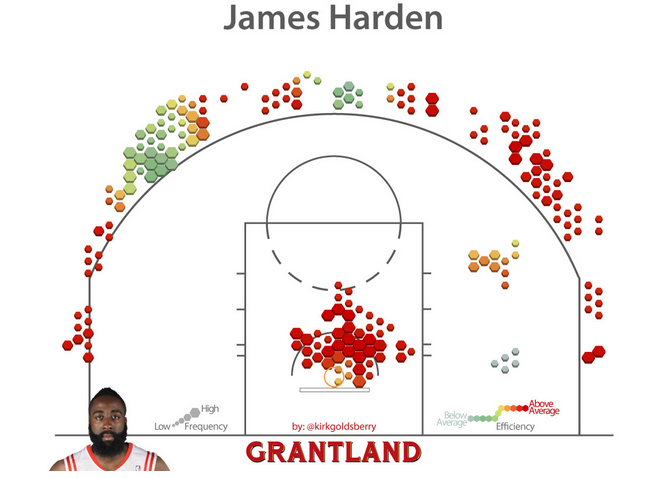
Harden rarely attempts any shots that are not at the rim or beyond the arc, because the Rockets philosophy suggests that mid-range shooting is inefficient. They’ve created a team based around a dominant low post presence in Dwight Howard and a wing like Harden, so as to best exemplify that philosophy.
The reason for such a philosophy is that the further you are from the basket, the more difficult the shot is, so if you’re going to take a difficult shot, why not shoot the one that is worth three points?
You’ll often hear basketball analysts talk about shooting splits. These are generally listed in the order of Field Goal Percentage (FG%), Three-point Field Goal Percentage (3P%) and Free Throw Percentage (FT%).
These are valuable tools to see how good a player is at each type of shot and the elite strive to make the 50/40/90 club, the benchmark numbers for each type of shot.
However, there is a ‘new’ statistic that attempts to quantify just how good a shooter is at all three: it’s known as True Shooting Percentage.
True Shooting Percentage is an invaluable tool. While percentages are important, there’s something to be said for volume as well – TS% attempts to give credence to both. If you’re a 45% three point shooter, that’s elite, but if you have only 50 attempts, it lessens the value. TS% takes account of both the amount of attempts in all three types of NBA shot and also the percentage made.
If you look at the TS% league leaders for 2014, you’ll see Spurs and Heat players littering the list. LeBron James ranked 3rd in the league, while Chris Bosh came in at 15 and Dwyane Wade at 24. The Spurs highest finisher was Marco Bellinelli at 9, followed by Kawhi Leonard at 17 and Manu Ginobili/Boris Diaw at 23 and 24, respectively.
This demonstrates Miami’s biggest strength – it’s most efficient players are also it’s biggest stars. Tim Duncan and Tony Parker rank in the 70’s in efficiency, still good, but not elite, which the Spurs make up for by having elite role players around them. In Miami, it’s the Big Three, and then it’s everyone else. It’s stars and scrubs vs. a balanced roster.
There are bevy of other shooting statistics. Everything is tracked. We can see how effective a player is off the dribble, going to their right, going to their left – all the information is there. We can see who is effective at catch and shoot vs. who is effective at driving to the basket. There’s a litany of data at our disposal. Teams use all of this when deciding what type of defense to play against a certain opponent. They try to create matchups that favour the trends laid out by the data. It’s really effective and really simple – you just need the right personnel to do it. No matchup is going to matter if your team is built around a bunch of chuckers and knuckleheads. I’m looking at you Swaggy P.
PASSING
Assist Percentage (AS%) and Assist Rate (AR) are two areas where the Spurs and Heat have the rest of the league at a disadvantage.
The Spurs always rank near the top of the league in AS%. This is the stat that quantifies how many of their baskets per game are created by a player assisting another. This is essential, because assists generally create easier baskets, which is kind of the whole point. The Spurs typically rank around 65% in AS% because of the elite point guard play of Tony Parker, as well as their commitment to making the extra pass. Plenty of teams have an elite point guard and don’t create nearly as many easy baskets as the Spurs do.
The Heat rank a bit lower in AS% – they’re close to the league average. However, they dominate in AR, which is the rate of assists against possessions used per player. A possession is classified as any time a team has the ball and it must end in either points, a missed shot or a turnover. As the Heat have a very high AR, this means that they are an unselfish team that can also create shots for themselves (unassisted shots). Their AS% is a bit lower, as they have James and Wade, who are capable of creating but their AR is high because they don’t waste possessions – when they have the ball, they make the most of it. The only problem? The Spurs are even better, having ranked 1st in AR in the league over the past four seasons, while the Heat are 3rd.
CUMULATIVE
The SportVU revolution is something I find very intriguing but is also something that is far too detailed for me to get into today. Essentially, the NBA now has cameras in every single NBA arena that track every minute piece of date you can imagine. They could tell you how many times a player dribbled for example. The real value to SportVU is on defense, as teams are able to input “ghosts” – fake players that show exactly, perfectly, where they would ideally want their team to be positioned on that end of the floor. They can then superimpose these ghosts on top of game footage, and show their players their good and bad tendencies. It’s really pretty crazy how detailed and effective a tool it is.
For years, NBA analysts have tried to come up with a statistic that combines all the things we’ve talked about today with a variety of other stats. Think of every basic NBA stat you know – points, assists, rebounds, steals, blocks. Each one of these has been broken down in the same way the passing stats were broken down in the previous section. There is rebound rate (split into offensive and defensive), there is steals and blocks per foul, which ostensibly shows you who can create turnovers without wasting fouls.
The cumulation of all that research has led to a statistic known as PER, Player Efficiency Rating.
It was created by former ESPN analyst and current Grizzlies front-office nerd John Hollinger. It’s a composite metric that is way beyond my understanding. Check it out here.
Many people have a problem with it – it puts a lot of emphasis on big men and scoring and there are various other foibles. Like WAR in baseball, since it’s such an amalgam of different things, there are bound to be those who disagree. That said, PER has entered the mainstream and the results seem to make sense: LeBron finished second in the league in PER this season and is second all time, to Michael Jordan. Tim Duncan is 12th all time, nearing the end of his career and thus, slipped to 21st in the league this season. Dwyane Wade, 8th all time in PER, is mid-way through the back nine of his run and finished 18th this season.
APER (Alternate Player Efficiency Rating) was developed later. Instead of the estimates PER used for assisted and unassisted field goals, it uses actual totals and also includes charges taken on the defensive end. The fact that one statistic can include all three of those things as just a small piece of its calculation means that it’s something the mainstream public will probably always take with a grain of salt.
THE REVOLUTION WILL NOT BE TELEVISED
If these are the statistics we know about, you can guarantee that there are a great many more being developed by teams that haven’t yet seen the light of day. Using statistics is about gaining an edge. They’re a tool to help understand why certain basketball teams play well and others, with seemingly better players, might not function as highly.
Statistics are fun to me. They give me greater insight into a game that I love. If they’re not for you, well, you probably didn’t make it this far.
But they can’t do this. This will always be the real reason that we watch.
Heat in 7.
